

Q1 2026 Market Update
Greater Annapolis
Anne Arundel County
the quarter in review
FIRST QUARTER
Q1 2026 felt less like a reversal and more like a reset into a more disciplined market. Across the Chesapeake regions, the quarter closed with fewer transactions than both late 2025 and, in most markets, the same quarter last year, but pricing held up better than activity did. That matters. When sales volume and transaction count soften faster than price, it usually signals a market that is becoming more selective rather than one that is materially weakening. Greater Annapolis and Greater Baltimore both preserved year-over-year price growth, Southern Maryland held roughly flat, and the Eastern Shore posted a more value-conscious mix with longer timelines and softer median pricing. Inventory rose across every region, days on market stretched higher, and buyers had more room to compare options before acting.
The economic backdrop helps explain that tone. Consumer confidence rebounded sharply from late 2025, unemployment held steady, and equity markets remained elevated, but mortgage rates also moved back into the mid-6% range. In practical terms, buyers felt better, but financing did not get easier. That combination supported engagement without recreating urgency. The result was a market where the best homes still moved decisively—especially by March—but average listings needed sharper pricing, stronger presentation, and more patience. Luxury and waterfront followed the same broad pattern: transaction count pulled back more than pricing did, which suggests higher-end demand is still present, just more discriminating than exuberant.


Greater Annapolis
Snapshot
Greater Annapolis opened 2026 on measured footing, but it never lost its pricing power. Q1 closed with 1,297 homes sold, down from both Q4 2025 and Q1 2025, yet the quarter’s average monthly median sale price still came in around $503K, up roughly 3.6% year over year. Sales volume eased to about $810M, days on market rose to just under 19 days, and inventory ended the quarter at 2.6 months, up from last year. In other words, the market slowed, but it did not buckle. Buyers had more choice and took more time, while sellers still captured close to full ask when homes were positioned correctly.
The more revealing story is how the quarter finished. January was cautious, but by March Greater Annapolis had climbed to 511 closings, returned to 100% of list price, and cut median days on market down to 14 days. That progression suggests the market found firmer footing as the quarter unfolded. After the rebound energy of spring 2025 and the more selective tone of late 2025, Q1 2026 looked like a continuation of normalization: demand was still there, but it was increasingly concentrated in homes that were priced right from day one.
$809,998,723
TOTAL SALES VOLUME
1297
TOTAL TRANSACTIONS
2.3
eoy months of inventoRy
19
median days on market
$502,833
median sales price
99.6%
list to sales price ratio


luxury markets
Greater Annapolis luxury softened in count but not in quality. Q1 2026 recorded 93 luxury sales, down roughly 19.8% year over year, yet the average luxury sale price climbed to about $1.86M, up more than 7% from Q1 2025 and well above late-2025 levels. That divergence is important: fewer buyers transacted, but those who did were still willing to pay for premium product. At the same time, luxury days on market rose to about 29 days, and median price per square foot eased, which suggests that buyers at the top end stayed engaged while demanding sharper property-specific value.
In practical terms, the Annapolis luxury market was resilient, just less automatic. The best homes still attracted strong money, but the broader high-end field took longer to clear and no longer benefited from blanket momentum. That is consistent with what we saw across 2025: the top end has depth, but it increasingly rewards uniqueness, presentation, and precision rather than simply benefitting from brand-name geography.
$1,749,472
AVERAGE PRICE IN
Q1
33
SALES IN
Q1
33
AVERAGE DOM IN
Q1
Luxury homes are defined as properties priced above $1M.
Figures reflect QTD closed sales from the most recent quarterly reporting period.

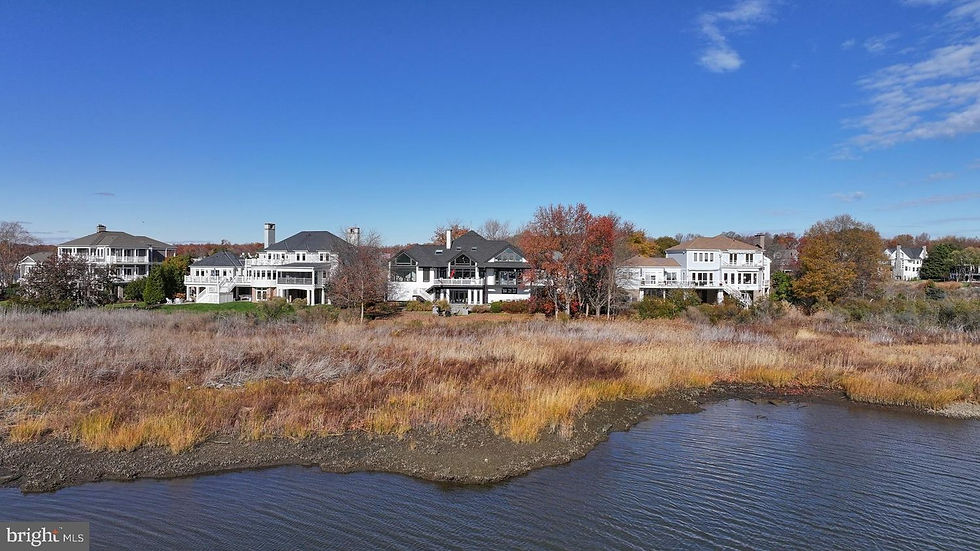
waterfront markets
Greater Annapolis waterfront remained one of the most important prestige categories in the report, and Q1 2026 held up better than the quarter’s slower tone might suggest. Waterfront sales reached 52, up modestly from Q1 2025, while average waterfront pricing came in around $1.71M. Price per square foot was lower than a year ago, but list-to-sale performance improved slightly and days on market actually came in a bit better than last year. That tells a nuanced story: buyers did not chase waterfront indiscriminately, but they still engaged where the product justified the number.
This is consistent with a market moving from momentum to discernment. In the Annapolis waterfront space, quality still wins, but condition, dock utility, location, and finish matter more now than they did when the entire category carried automatic scarcity value. The segment remains healthy; it is simply more refined in what it rewards.
$1,714,527
AVERAGE PRICE IN
Q1
52
SALES IN
Q1
39
AVERAGE DOM IN
Q1
Waterfront homes are defined as properties with direct water access from the property.
Figures reflect QTD closed sales from the most recent quarterly reporting period.
Top Sales
THIS QUARTER


Buyer Behavior
A closer look at how buyers are navigating today’s market
If someone asks you about the market last quarter, the simplest way to describe Greater Annapolis buyers this quarter is this: they were no longer rushing first and analyzing later, but they still moved quickly when a home felt right. More inventory and longer timelines gave buyers room to compare, inspect, and negotiate, especially in January and February. At the same time, March showed that well-priced homes were still capable of drawing full-price outcomes and quick decisions. So the leverage was real, but it was not unlimited.
That distinction matters. Buyers gained confidence from having more options, yet the market never became truly soft. The best listings still stood out, especially when presentation matched price. In a practical sense, Q1 2026 buyers in Greater Annapolis behaved like rational opportunists: patient with average inventory, decisive with standout product, and notably less willing to pay a premium for homes that needed work or lacked a compelling edge.

Annapolis
Annapolis delivers a distinctive blend of historic charm, maritime culture, and walkable urban living, attracting residents drawn to water access, dining, and cultural vibrancy.

Arnold
Arnold supports an active, community-focused lifestyle shaped by nearby waterways, parks, and trails, paired with everyday convenience close to downtown Annapolis.
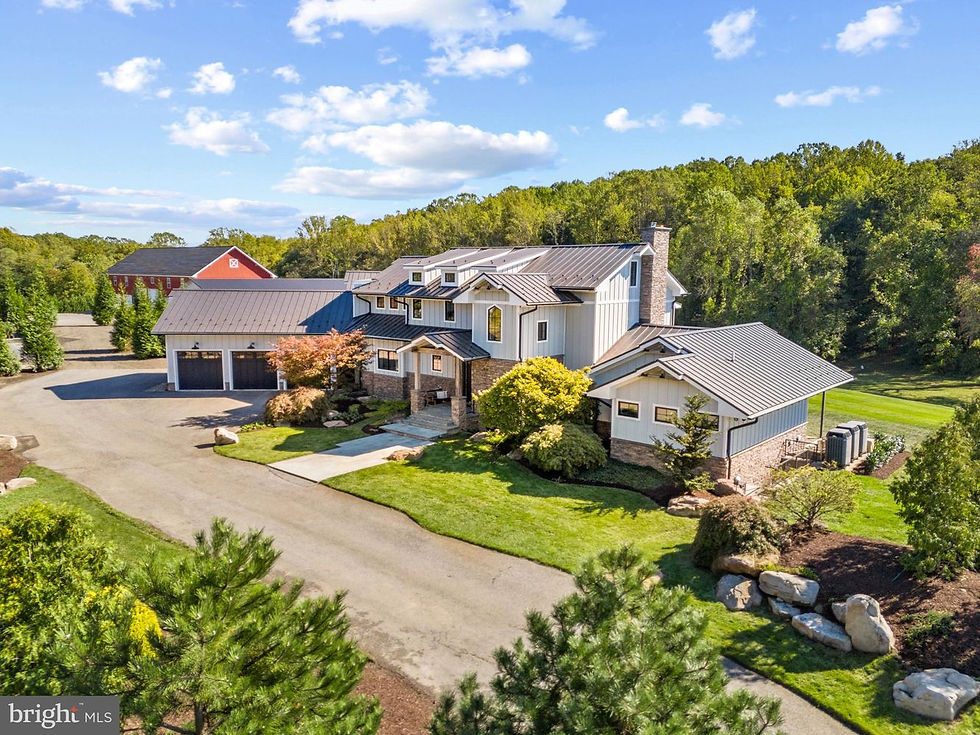
Davidsonville
Davidsonville appeals to buyers seeking space, privacy, and a semi-rural setting, balancing estate-style living with convenient access to Annapolis and regional centers.
Town Spotlights
Within the region, certain communities stood out during the quarter based on activity and buyer interest

Looking Ahead
The market is moving forward with more balance than urgency. Buyers are acting with greater selectivity, sellers are being rewarded for precision, and the gap between standout listings and everything else is becoming easier to see.


More Than Real Estate.
It’s How You Live Here.
Buying or selling a home is just the start.
What matters is understanding the place around it — the market, the lifestyle, the culture, the communities, and the forces shaping what comes next. That’s what we do.
.png)
2077 Somerville Rd
suite 200
Annapolis, MD 21401