Greater Annapolis
Q3 2024
MARKET REPORT
THIRD QUARTER
MARKET REPORT
As summer faded, Greater Annapolis entered a phase of composed normalization. Sales and volume eased modestly, inventory slowly climbed, and prices dipped—signaling a market that was stepping back rather than stalling. Yet beneath the surface, demand remained alive in mid- and upper-tier homes, with quick turnovers and sustained interest. Luxury and waterfront segments held their own, balancing elevated pricing with earnest buyer engagement. This quarter was less about heat and more about balance—a thoughtful reset, captured here with clarity and nuance.


INDICATORS
STOCK MARKET (DOW JONES)
CONSUMER CONFIDENCE
MORTGAGE RATE (US 30 YR)
UNEMPLOYMENT RATE
3/31/24
39,807.37
104.7
6.79%
3.8%
9/30/23
33,507.50
103.0
7.18%
3.8%
9/30/24
42,330.15
98.7
6.23%
4.1%
.png)

DATES
9/30/24
3/31/24
9/30/23
GDP
3.1%
1.3%
4.9%
Economic Factors

Impact On The Market
By Q3 2024, the market settled into a more deliberate pace. Nationally, GDP growth remained strong and mortgage rates eased slightly, giving buyers breathing room. Locally, sales and volume softened modestly, median prices dipped slightly, and inventory rose across most regions—signs of normalization rather than weakness. Days on market crept higher, but homes still moved briskly when priced and presented well. Luxury and waterfront properties continued to show resilience, though activity lengthened at the top end. Entry-level buyers welcomed more options, while mid-tier and move-up segments remained healthy. Q3 was not about frenzy—it was about recalibration, with balance returning to the market.
For Sellers:
Market pace slowed, but well-positioned listings still commanded attention.
Luxury and mid-tier homes held strong, though patience was sometimes required.
Rising inventory emphasized the importance of presentation.
For Buyers:
More options meant greater room to negotiate.
Less urgency allowed for thoughtful decisions—except in high-demand tiers.
Selectivity was rewarded, especially in waterfront and luxury markets.
year over year
Trends For The Quarter
REGIONS
Greater Annapolis
Greater Baltimore
Eastern Shore
Southern Maryland
CLOSED UNITS
2063
5174
460
1355
TOTAL
VOLUME
$1,183,628,213
$2,107,146,375
$286,604,768
$648,182,321
EOM INVENTORY
1.5
2.2
3.2
1.9


CURRENT INVENTORY
1,063
15.4%
YOY CHANGE
QTD CLOSED VOLUME
$1,183,628,213
4.2%
YOY CHANGE
QTD CLOSED SALES
2063
4.4%
YOY CHANGE
12-MO AVERAGE SALES PRICE
$582,177
7.3%
YOY CHANGE
Greater Annapolis
AT A GLANCE
.png)
YEAR
CLOSED SALES
CLOSED SALES VOLUME
MEDIAN DAYS ON MARKET
MEDIAN SALES PRICE
INVENTORY
.
Q2 2024
2104
$1,282,227,936
6
$499,550
1.3
.
Q3 2024
2063
$1,183,628,213
7
$485,342
1.5
.
CHANGE
-1.9%
-7.7%
29.4%
-2.8%
15.4%

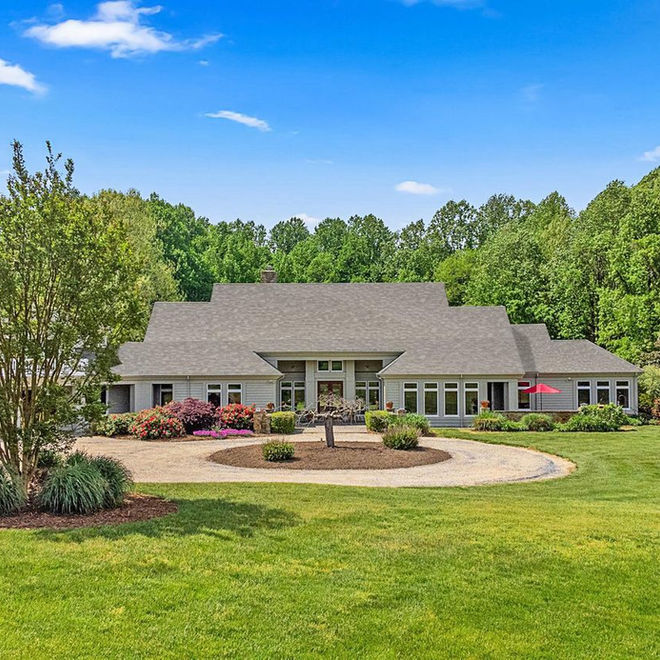
$3,800,000 | Edgewater, MD
71 Wallace Manor Rd

SINGLE FAMILY HOME SALES & INVENTORY BY RANGE
PRICE POINT
UNDER $500,000
$500,000-$999,999
$1,000,000-$1,499,999
$1,500,000-$1,999,999
$2,000,000-$2,999,999
$3,000,000+
.
Q3 2023
500
563
64
36
16
9
.
Q3 2024
506
600
78
25
13
8
.
CHANGE
1.2%
6.6%
21.9%
-30.6%
-18.8%
-11.1%

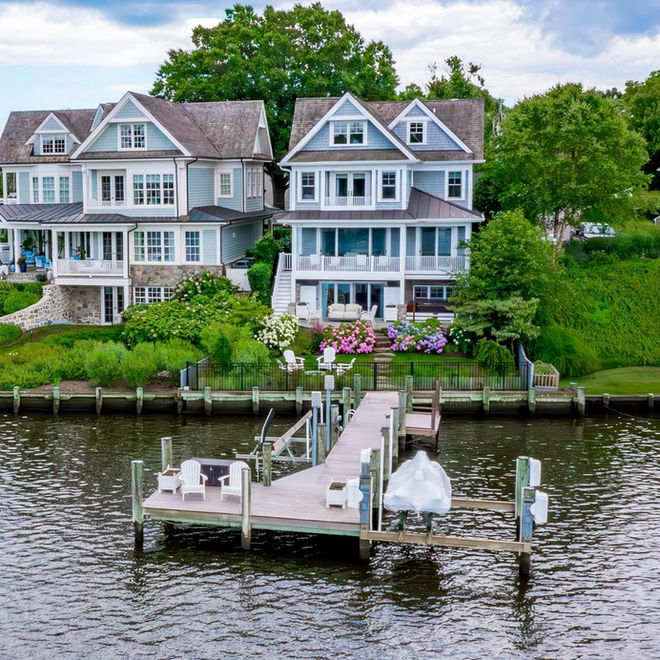
$6,750,000 | Gibson Island, MD
748 Skywater Dr

$6,150,000 | Annapolis, MD
201 Lockwood Ct

TOWNHOME SALES & INVENTORY BY RANGE
PRICE POINT
UNDER $500,000
$500,000-$999,999
$1,000,000-$1,499,999
$1,500,000-$1,999,999
$2,000,000-$2,999,999
$3,000,000+
.
Q3 2023
460
177
1
0
0
0
.
Q3 2024
461
212
3
2
1
1
.
CHANGE
0.2%
19.8%
200.0%
--
--
--

$6,150,000 | Annapolis, MD
201 Lockwood Ct

$6,750,000 | Gibson Island, MD
648 Roundhill Rd

CONDO SALES & INVENTORY BY RANGE
PRICE POINT
UNDER $500,000
$500,000-$999,999
$1,000,000-$1,499,999
$1,500,000-$1,999,999
$2,000,000-$2,999,999
$3,000,000+
.
Q3 2023
101
19
1
1
0
0
.
Q3 2024
126
12
0
0
0
0
.
CHANGE
24.8%
-36.8%
-100.0%
-100%
--
--

WATERFRONT MARKET
DATA POINT
CLOSED SALES
AVERAGE SALES PRICE
MEDIAN PRICE PER SQFT
LIST TO SALE PRICE RATIO
MEDIAN DAYS ON MARKET
.
Q3 2023
85
$1,542,965
$524.52
97.4%
10
.
Q3 2024
70
$1,519,015
$514.25
96.1%
15
.
CHANGE
-17.6%
-1.6%
-2.0%
-1.3%
58.6%


LUXURY MARKET
DATA POINT
CLOSED SALES
AVERAGE SALES PRICE
MEDIAN PRICE PER SQFT
LIST TO SALE PRICE RATIO
MEDIAN DAYS ON MARKET
.
Q3 2023
128
$1,748,020
$474.79
100.0%
7
.
Q3 2024
131
$1,619,244
$430.92
98.2%
9
.
CHANGE
2.3%
-7.4%
-9.2%
-1.8%
33.3%


READY WHEN YOU ARE
You don’t have to do life like everyone else
If you’re craving content that feels like a deep breath, a brand that mirrors your evolution, or a space that honors both your ambition and your rest… you’ve found your corner of the internet. Stay awhile. Explore. And if it speaks to you, let’s build something beautiful together.


