


© 2025 by Housecats, LLC. Made with Wix Studio™. privacy policy | terms and conditions | ACCESSIBILITY STATEMENT | compass.com
Sell Buy Markets Guides Media Company
Housecats Co.
2077 Somerville Rd
Suite 200
Annapolis, MD 21401

Q2 2026 Market Update
Greater Annapolis
Anne Arundel County
le quarter dans analyse
SECOND QUARTER
Greater Annapolis produced a meaningful expansion in transaction activity during Q2 2026. The market recorded 2,210 closed sales, 70.4% more than in Q1 and 8.0% above Q2 2025. Sales volume reached $1.442 billion, increasing 78.0% quarter over quarter and 11.9% year over year. Normal spring seasonality accounts for part of the sequential acceleration, but the annual gains indicate that the improvement extended beyond the customary rise from winter. With year-to-date sales only 1.8% ahead of the prior year, Q2 appears to have supplied much of the first half’s positive momentum.
Pricing told a less uniform story. The median sale price rose 3.5% from Q1 to $520,250 but remained 5.9% below the same quarter last year. Median list price was also lower year over year, declining 4.3% to $526,800. Yet completed transactions achieved 100.0% of list price, while available supply measured 2.4 months. The figures suggest that the properties reaching the closing table were generally well aligned with their final asking prices, even as buyers encountered a somewhat broader and more varied selection.
The most revealing divergence was between price and volume. Sales volume increased faster than the number of homes sold, despite the lower median price. Combined with the comparatively strong growth in luxury and waterfront transactions, this is consistent with a wider distribution of sales rather than a uniform decline in property values. Median days on market nearly doubled from the prior year to 24, but the absolute period remained relatively brief. Greater Annapolis was therefore more active without becoming indiscriminately competitive: liquidity strengthened, while outcomes remained dependent on segment, condition, and pricing discipline.


Greater Annapolis
Aperçu
The Greater Annapolis core market entered Q2 with considerably greater transaction depth. Closed sales increased to 2,210, while sales volume reached $1.442 billion. Compared with Q2 2025, those measures rose 8.0% and 11.9%, respectively, demonstrating that more capital moved through the market even as the median sale price declined 5.9% to $520,250.
Supply remained constrained at 2.4 months of inventory, only modestly above the prior quarter and 6.0% higher than a year earlier. Homes that closed achieved 100.0% of list price, although the median marketing period increased to 24 days. The combination points to a market that allowed somewhat more time for price discovery without producing widespread concessions at closing. Buyers gained a measure of additional choice, but sellers of properly positioned homes continued to retain meaningful leverage.
$1,441,917,847
TOTAL SALES VOLUME
2,210
TOTAL TRANSACTIONS
2.4
eoy months de inventaire
24
median jours sur le marché
$520,250
median prix de vente
100.0%
list to sales price ratio


luxury markets
Greater Annapolis luxury activity expanded at a pace well above the overall market during Q2. The segment recorded 233 sales, an increase of 150.5% from Q1 and 18.9% from a year earlier. The quarter-over-quarter gain reflects both spring seasonality and a comparatively small first-quarter base, but the annual increase confirms a meaningful broadening of luxury transaction volume. Luxury sales grew more than twice as quickly as overall sales on a year-over-year basis, likely contributing disproportionately to the region’s 11.9% increase in total sales volume.
The average luxury sale price declined 8.5% from Q1 to $1,699,511 and was 1.0% below Q2 2025. Median price per square foot, however, rose 10.5% quarter over quarter and 1.8% year over year to $461.03. The contrast between a lower average transaction price and a higher unit value is consistent with a change in the properties sold, potentially including a greater number of smaller or comparatively lower-priced luxury homes. It does not, on its own, indicate weakening values across the segment.
Execution remained particularly strong. Luxury homes achieved 100.0% of list price and recorded a median market time of just 6 days, down from 29 days in Q1. Although that marketing period was 21.4% longer than the exceptionally compressed prior-year level, it remained the fastest of the reported Greater Annapolis segments. The evidence points to a market in which luxury buyers were prepared to act quickly when price, condition, and property distinction aligned.
$1,699,511
AVERAGE PRICE IN
Q2
233
SALES IN
Q2
6
AVERAGE DOM IN
Q2
Luxury homes are defined as properties priced above $1M.
Figures reflect QTD closed sales from the most recent quarterly reporting period.
.jpg)

waterfront markets
Greater Annapolis waterfront activity strengthened materially during Q2. The market recorded 111 waterfront sales, 113.5% more than in Q1 and 18.1% above Q2 2025. While the spring season explains part of the sequential increase, the annual gain establishes a deeper pool of completed waterfront transactions than during the prior-year quarter.
Liquidity improved more clearly than pricing. Median market time fell from 39 days in Q1 to 9 days, a 77.6% reduction, and was 36.6% shorter than a year earlier. Waterfront properties therefore moved in considerably less time than the 24-day median for the Greater Annapolis market overall. The sale-to-list ratio also strengthened to 98.7% from 95.1% in the first quarter, indicating closer alignment between sellers and the buyers who ultimately closed.
Price measures remained more restrained. The average waterfront sale price declined 3.1% quarter over quarter and 5.8% year over year to $1,660,933. Median price per square foot increased sharply from Q1 to $549.46 but remained 3.0% below Q2 2025. This divergence suggests that the composition of waterfront sales changed during the quarter, potentially broadening beyond the highest total-price properties. Q2 was therefore defined less by generalized price expansion than by stronger transaction velocity and decisive demand for well-positioned waterfront inventory.
$1,660,933
AVERAGE PRICE IN
Q2
111
SALES IN
Q2
9
AVERAGE DOM IN
Q2
Waterfront homes are defined as properties with direct water access from the property.
Figures reflect QTD closed sales from the most recent quarterly reporting period.
THIS QUARTER'S
Top Sales


Buyer Behavior
Greater Annapolis buyers increased their participation in Q2 while remaining sensitive to the distinction between broadly available inventory and scarce, differentiated homes. Overall transactions rose 8.0% year over year, even as months of inventory increased to 2.4 and median days on market reached 24. The longer marketing period suggests that buyers had somewhat more opportunity to compare alternatives, but the 100.0% sale-to-list ratio shows that successful transactions generally concluded at the final asking price.
Behavior differed sharply by segment. Luxury properties recorded a 6-day median market time, while waterfront homes recorded 9 days. Those shorter periods indicate that buyers moved considerably faster when presented with property types that are inherently less interchangeable. The lower year-over-year median list and sale prices in the overall market may also reflect a broader range of homes changing hands, rather than buyers securing uniform discounts.
The 30-year fixed mortgage rate stood at 6.54% at quarter-end, keeping the cost of capital relevant to purchase decisions. The supplied figures do not establish how financing conditions affected individual buyers, but the market pattern is consistent with measured evaluation followed by rapid action when a property met expectations. Buyers were not absent or broadly hesitant; their urgency was concentrated rather than evenly distributed.


Annapolis
Annapolis delivers a distinctive blend of historic charm, maritime culture, and walkable urban living, attracting residents drawn to water access, dining, and cultural vibrancy.

Arnold
Arnold supports an active, community-focused lifestyle shaped by nearby waterways, parks, and trails, paired with everyday convenience close to downtown Annapolis.
Davidsonville
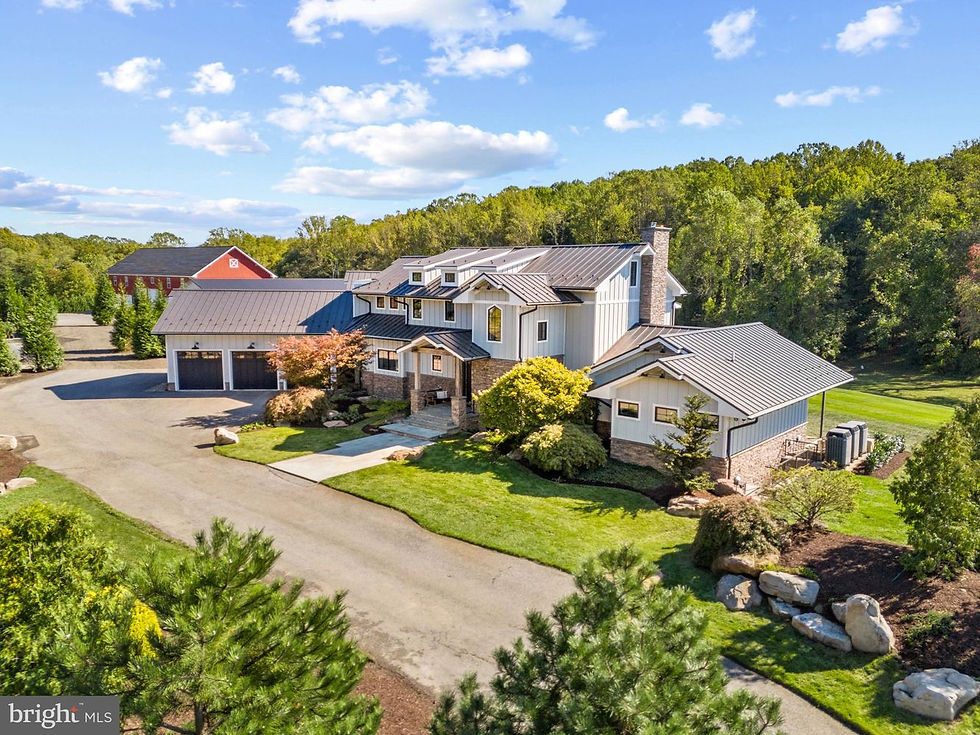
Davidsonville appeals to buyers seeking space, privacy, and a semi-rural setting, balancing estate-style living with convenient access to Annapolis and regional centers.
Town Spotlights
Within the region, certain communities stood out during the quarter based on activity and buyer interest
Looking Ahead
Greater Annapolis enters the second half of 2026 with stronger transaction momentum but without evidence of uniform price acceleration. Q2 sales were 8.0% higher than a year earlier, while luxury and waterfront transactions increased 18.9% and 18.1%, respectively. Yet year-to-date sales were only 1.8% ahead, indicating that the second quarter materially improved the first-half trajectory rather than confirming a long-established expansion.
At 2.4 months of inventory, supply remains limited enough to support sellers whose properties are aligned with current buyer expectations. Should inventory rise gradually while demand holds, the market could gain selection without immediately producing substantial price concessions. A faster increase in supply, particularly among similar properties, could extend marketing periods and place greater emphasis on initial pricing. Conversely, constrained new inventory would likely preserve the strongest competition in luxury, waterfront, and other differentiated segments.
The quarter ended with the 30-year fixed mortgage rate at 6.54%, unemployment at 4.20%, GDP at 2.10%, and consumer confidence at 91.2. Because the report provides point-in-time readings rather than directional comparisons, those figures establish context but not a trend. A reduction in borrowing costs could bring additional buyers into the market, though stronger demand might also absorb new inventory and limit the benefit of improved affordability. If rates remain near the quarter-end level, payment sensitivity and property-specific value are likely to remain central. New listings, pending sales, price reductions, and segment-level inventory will provide the clearest early evidence of the market’s next direction.
.jpg)
Local Intelligence. Modern Reach.
The Housecats Company is an Annapolis-based Compass real estate team specializing in luxury, waterfront, and lifestyle properties across Maryland and Washington, D.C. Our group brings together local expertise, market interpretation, media strategy, and client guidance across Maryland’s most distinctive communities. Sign-up to receive our newsletters and join the pride.

2077 Somerville Rd
suite 200
Annapolis, MD 21401
