


© 2025 by Housecats, LLC. Made with Wix Studio™. privacy policy | terms and conditions | ACCESSIBILITY STATEMENT | compass.com
Sell Buy Markets Guides Media Company
Housecats Co.
2077 Somerville Rd
Suite 200
Annapolis, MD 21401

Q2 2026 Market Update
Eastern Shore
Queen Anne's County | Kent County | Talbot County
the quarter in review
SECOND QUARTER
The Eastern Shore entered the second quarter of 2026 with a meaningful expansion in transaction activity, though the evidence points to a market that remained selective rather than broadly exuberant. At quarter-end, the 30-year fixed mortgage rate stood at 6.54% and consumer confidence registered 91.2, keeping affordability and conviction central to purchase decisions. The region recorded 476 closed sales, 44.7% more than in Q1 and 3.7% more than in Q2 2025. Sales volume reached $312.8 million, rising 57.3% quarter over quarter but a more measured 1.3% year over year. Because the transition from Q1 to Q2 carries a natural seasonal lift, the annual comparisons provide the clearer signal: transaction activity strengthened, but not dramatically.
Pricing presented a more layered picture. The median sale price advanced 5.5% from the first quarter to $494,148, yet remained 1.8% below the same period last year. Median list price, by contrast, was 1.0% higher year over year, while the sale-to-list ratio improved from 95.9% to 98.2%. Taken together, the figures are consistent with better alignment among the properties that successfully closed, rather than uniform appreciation across the market.
The counterweight was time and choice. Months of inventory increased to 5.3, 12.8% above the prior year, and median days on market reached 53. Buyers therefore had more latitude to compare alternatives, while sellers faced a higher standard for pricing, condition, and presentation. Q2 rewarded precision: activity broadened, but the market did not suspend its discipline. The economic figures appear on page 1 and the Eastern Shore data on page 2 of the supplied report.


Eastern Shore
Snapshot
The Eastern Shore recorded 476 home sales in Q2 2026, a 44.7% increase from the first quarter and 3.7% more than a year earlier. Total sales volume reached $312.8 million, rising 57.3% quarter over quarter and 1.3% year over year. The median sale price increased to $494,148 from Q1 but remained 1.8% below Q2 2025, indicating that the quarter’s stronger activity was driven more by increased turnover than by broad-based price appreciation.
Market conditions nevertheless became more accommodating for buyers. Months of inventory rose to 5.3, while median marketing time extended to 53 days. Even with more supply and longer decision periods, successful properties closed at 98.2% of list price, an improvement from 95.9% in the prior quarter. The combination suggests a market in which buyers had greater latitude to compare options, but well-positioned homes continued to command relatively disciplined outcomes. For sellers, Q2 placed a premium on accurate pricing and presentation; for buyers, additional choice did not necessarily translate into substantial discounts.
$312,799,445
Total Sales Volume
476
Total Transactions
5.3
months of inventory
53
median days on market
$494,148
median sales price
98.2%
list to sales price ratio


luxury markets
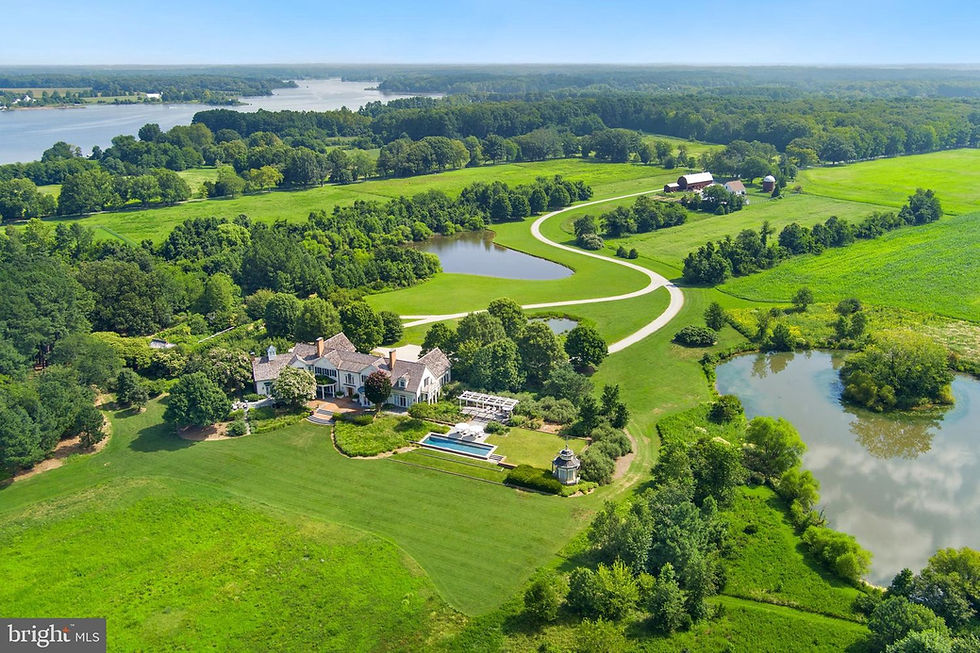
The Eastern Shore luxury segment delivered a substantial expansion in transaction activity during Q2 2026. Sixty-three homes sold, a 142.3% increase from the first quarter and 5.0% more than in Q2 2025. The quarter-over-quarter gain was amplified by the spring selling season and a comparatively small Q1 base, but the positive annual comparison confirms that the improvement was not seasonal alone. Median days on market fell from 37 to 16, while completed sales achieved 96.5% of list price, up from 93.6% in the prior quarter. Together, those measures point to improved liquidity and more effective alignment between sellers and the buyers who ultimately committed.
Pricing was more nuanced. The average luxury sale price declined 11.3% quarter over quarter and 5.5% year over year to $1,849,960, even as median price per square foot increased 4.1% from Q1 to $473.54. That divergence is consistent with a change in the composition of properties sold rather than a uniform decline in value; the data does not provide the size, location, or price distribution necessary to isolate the effect. With median price per square foot still 5.9% below the prior year, the evidence supports a stronger liquidity narrative more clearly than an appreciation narrative. Q2 broadened the number of successful luxury transactions, but pricing outcomes remained highly property-specific.
$1,849,960
AVERAGE PRICE IN
Q2
63
SALES IN
Q2
16
AVERAGE DOM IN
Q2
Luxury homes are defined as properties priced above $1M.
Figures reflect QTD closed sales from the most recent quarterly reporting period.
.jpg)
.jpg)
waterfront markets
Waterfront activity accelerated meaningfully from the opening quarter of 2026. The Eastern Shore recorded 72 waterfront sales, 71.4% more than in Q1, while median days on market declined from 43 to 23. Successful transactions closed at 96.6% of list price, compared with 95.3% in the prior quarter. These measures describe a materially more fluid spring market in which properly positioned waterfront properties found buyers more efficiently.
The annual comparisons, however, provide an important qualification. Waterfront sales remained 7.7% below Q2 2025, and median market time was 23.6% longer than a year earlier. The average waterfront sale price reached $1,537,821, rising 5.4% from Q1 but remaining 3.5% below the prior year. Median price per square foot followed a similar pattern, advancing 16.4% quarter over quarter to $451.52 while trailing Q2 2025 by 5.9%. Because both pricing measures can shift with the mix of shoreline, property size, improvements, and other attributes, the figures should not be read as uniform changes in underlying property values.
Within the quarter, waterfront homes moved considerably faster than the Eastern Shore market overall, where median days on market reached 53. That divergence suggests that differentiated waterfront inventory attracted more decisive engagement when pricing and market expectations aligned. Even so, lower annual sales and pricing measures indicate that Q2 represented improved execution rather than unrestricted price growth.
$1,537,821
AVERAGE PRICE IN
Q2
72
SALES IN
Q2
23
AVERAGE DOM IN
Q2
Waterfront homes are defined as properties with direct water access from the property.
Figures reflect QTD closed sales from the most recent quarterly reporting period.
THIS QUARTER'S
Top Sales


Buyer Behavior
Eastern Shore buyers increased their participation in Q2 without surrendering the advantages created by broader supply. Closed sales rose to 476, 3.7% above the prior year, while months of inventory increased 12.8% to 5.3 and median days on market extended to 53. The combination suggests that buyers had more opportunity to compare properties and assess value, even as transaction volume improved. At closing, homes achieved 98.2% of list price, indicating that successful transactions generally concluded near the asking price in effect at the time of sale.
That distinction is important: a strong list-to-sale ratio does not necessarily mean that homes received their original asking prices. Without price-reduction or original-list-price data, some listings may have required adjustment before buyer and seller expectations converged. The broader pattern is therefore not one of indiscriminate discounting, but of additional evaluation time followed by relatively disciplined agreements once a property was positioned appropriately.
Buyer behavior was also distinctly segmented. Luxury homes recorded a median of 16 days on market, while waterfront properties recorded 23, both substantially faster than the 53-day market-wide median. This disparity is consistent with buyers acting more quickly on differentiated properties while exercising greater patience among more broadly available alternatives. With the 30-year fixed mortgage rate at 6.54% at quarter-end, financing costs remained an important part of the purchase equation, although the supplied data cannot establish their direct effect on individual decisions.

Chestertown
Chestertown blends historic charm with a relaxed pace of life, attracting residents drawn to community, heritage, and a quieter Eastern Shore setting.

Easton
Easton offers a refined small-town lifestyle with a vibrant arts scene, dining, and everyday convenience, appealing to buyers seeking charm without isolation.

Oxford
Oxford delivers a quiet, traditional waterfront lifestyle centered on boating, privacy, and historic architecture, appealing to buyers seeking understated coastal living.
Town Spotlights
Within the region, certain communities stood out during the quarter based on activity and buyer interest
Looking Ahead
The Eastern Shore enters the second half of 2026 with greater transaction depth, but also with conditions that are increasingly dependent on property type and positioning. At 5.3 months of inventory and 53 median days on market, the broader market offers buyers more choice and time than it did a year earlier. Yet the 98.2% sale-to-list ratio—and the considerably shorter marketing periods recorded in the luxury and waterfront segments—shows that additional supply has not eliminated seller leverage for properties that meet prevailing expectations.
Should these relationships persist, the next quarter may continue to operate as a two-speed market. Distinctive, accurately positioned properties could remain comparatively liquid, while homes competing within deeper pools of similar inventory may require more time or adjustment. The principal risk for sellers is therefore not simply rising supply, but misreading how their individual property compares with the alternatives available at the same moment.
The economic backdrop at June 30 included a 6.54% 30-year fixed mortgage rate, 4.20% unemployment, 2.10% GDP, and consumer confidence of 91.2. Because the dataset provides only quarter-end readings, it does not establish whether those indicators improved or weakened during Q2. If mortgage rates decline, incremental purchasing power could support additional demand; if borrowing costs remain near the quarter-end level, payment sensitivity is likely to keep value and pricing discipline central to buyer decisions. New listings, pending activity, price reductions, and showing trends will offer a more immediate indication of Q3 direction than closed sales alone.
.jpg)
Local Intelligence. Modern Reach.
The Housecats Company is an Annapolis-based Compass real estate team specializing in luxury, waterfront, and lifestyle properties across Maryland and Washington, D.C. Our group brings together local expertise, market interpretation, media strategy, and client guidance across Maryland’s most distinctive communities. Sign-up to receive our newsletters and join the pride.

2077 Somerville Rd
suite 200
Annapolis, MD 21401
